 By:
By: After the summer break, Formula 1 resumes at Zandvoort for the final time since returning to the calendar in 2021. It will be a Sprint-format weekend, making the teams’ preparation at their factories crucial to getting the most from the weekend, starting with the sole practice session. Thanks to the work of Eloy Aparacio, we have simulated a qualifying lap of the Dutch circuit. The Power Unit information was published by the FIA on 19 August 2026 and sets a maximum recharge of 7.5 MJ for Sprint qualifying and qualifying, a power-limitation distance of 2,411 metres, and a maximum PU power reduction rate of 100 kW/s.

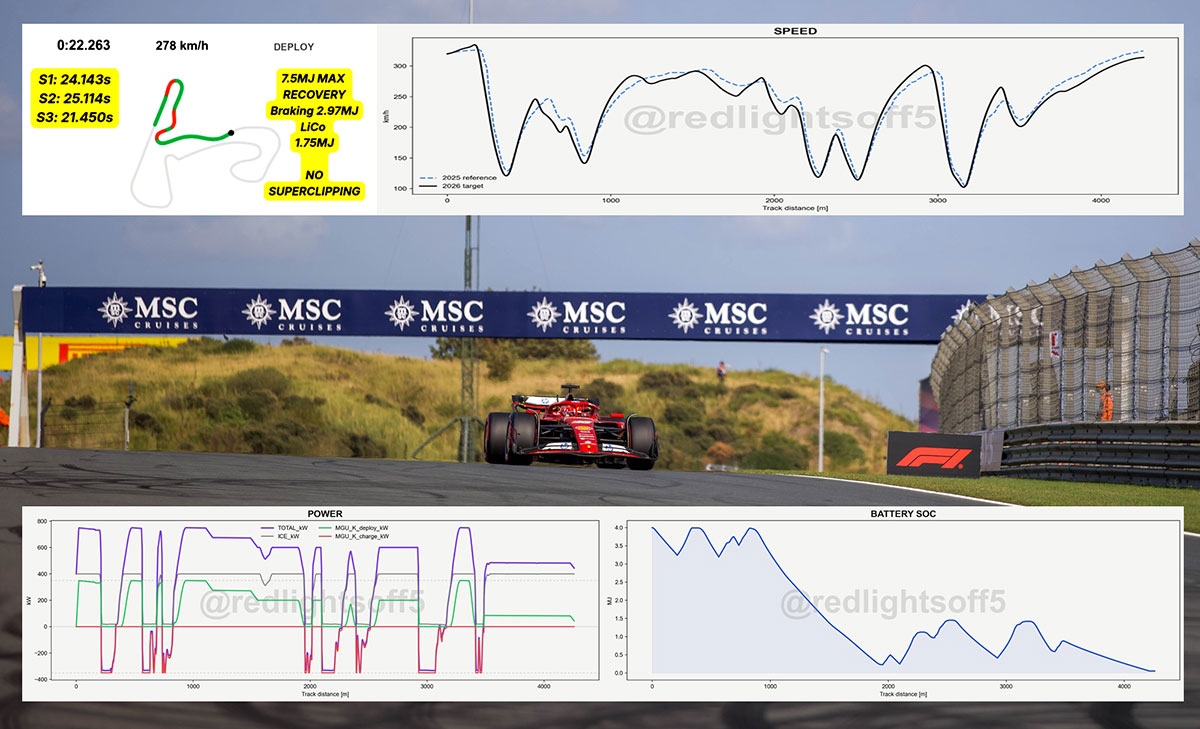
Figure 1 — Modelled ERS-K activity over the lap: green = positive deployment; red = recovery.
Lap time and speed profile
The simulation produces a lap time of 1:10.707, 2.045s slower than the 1:08.662 set by Oscar Piastri for pole position in 2025. The predicted top speed is 334.8 km/h, compared with 326.5 km/h last year, but the straight-line gain is not enough to recover the time lost in the corners.
| Sector | 2025 [s] | 2026 [s] | Delta | Delta % |
| S1 | 23.367 | 24.141 | +0,774 s | +3,31% |
| S2 | 24.476 | 25.110 | +0,634 s | +2,59% |
| S3 | 20.819 | 21.455 | +0,636 s | +3,06% |
| Lap | 68.662 | 70.707 | +2,045 s | +2,98% |
The sector values above were obtained by mapping the 2025 sector timestamps onto the cumulative distance/time profile provided. The first sector records the largest absolute loss over the lap.

Figure 2 — Speed trace. Dashed blue line = 2025 reference; black line = 2026 target.
| 1:10.707 Predicted time |
+2,045 s vs 2025 pole position |
334,8 km/h Predicted top speed |
| 8,70 MJ MGU-K deployed |
4,72 MJ MGU-K recovered |
4,00 → 0,05 MJ SOC start → finish |
Where cornering losses are concentrated
The speed variation is not uniform. The largest local losses in minimum speed in the supplied profile occur in the medium-speed sections of the lap. The slower corners are much closer to the 2025 reference.
| Distance from finish line | 2025 min [km/h] | 2026 min [km/h] | Delta [km/h] |
| ~370 m | 129 | 121 | -7,9 |
| ~836 m | 154 | 141 | -12,4 |
| ~2056 m | 241 | 222 | -19.0 |
| ~2276 m | 124 | 119 | -5,5 |
| ~2514 m | 117 | 114 | -3.1 |
| ~3168 m | 104 | 102 | -1,4 |
| ~3496 m | 212 | 202 | -10,3 |
These values represent local minima over short intervals around the indicated lap positions, rather than speeds sampled at a precise point. They should be interpreted as corner-level indicators rather than point telemetry data.
Energy deployment and recovery
The model is based on an ICE contribution of around 400 kW and a maximum ERS-K limit of 350 kW. Peak combined power is therefore close to 750 kW when full electrical deployment is available. The lap deploys 8.703 MJ through the MGU-K and recovers 4.720 MJ.
| Energy | Interpretation | ||
| MGU-K deployed | 8,703 MJ | Positive electrical power at the wheels | |
| Braking recovery | 2,974 MJ | 63,0% of energy recovered | |
| Other recovery | 1,747 MJ | 37,0%; non-braking/part-throttle recovery in the model | |
| Dedicated superclip | 0,000 MJ | No negative-torque superclipping event in this run | |
 Figure 3 — Modelled power. Purple = total; grey = ICE; green = MGU-K deployment; red = MGU-K recovery.
Power deployment is deliberately reduced in several medium-speed sections, rather than being maintained at 350 kW everywhere. In this target profile, energy is prioritised for acceleration zones and high-speed sections, where electrical power delivers a greater lap-time benefit. This should be regarded as the model’s strategic outcome, not as an FIA-mandated power level at those points.
Battery state of charge
The energy stored in the battery at the start of the flying lap is 4.00 MJ and finishes with a reserve of 0.05 MJ. The state of charge (SOC) falls sharply during the first half of the lap, is replenished in the main recovery zones, and is then consumed again towards the end of the lap.

Figure 4 — Battery state-of-charge simulation. Start = 4.00 MJ; finish = 0.05 MJ.
Model interpretation
The 2026 car model gains on the straights but loses more in medium-speed corners. This results in a net lap-time deficit of 2.045s despite an 8.3 km/h higher Vmax. The ERS system is managed according to energy rather than being constrained by recharge capacity, and the high-speed ERS reduction function in qualifying does not activate.
| Operational metric | Duration | Definition |
| Full/nearly full throttle* | 39,7 s | 56,1% of the predicted lap |
| Speed decreasing | 29,1 s | 41,2% of the predicted lap |
| Below 150 km/h | 15,55 s | Estimated 2026 speed |
| Above 300 km/h | 4,87 s | Estimated 2026 speed |
* Full/nearly full throttle is defined here as the 2025 reference throttle channel being at least 95%. Using exactly 100% would produce a much shorter duration, so the threshold must be stated explicitly.
Updated F1 drivers’ and constructors’ standings