 By:
By: As usual, on the eve of the Singapore Grand Prix, we bring you Eloy Aparicio’s simulation of a qualifying lap. The analysis is based on the physics of the 2026 cars and the FIA-defined limits on Power Unit electrical-energy deployment for the world championship round at Marina Bay.

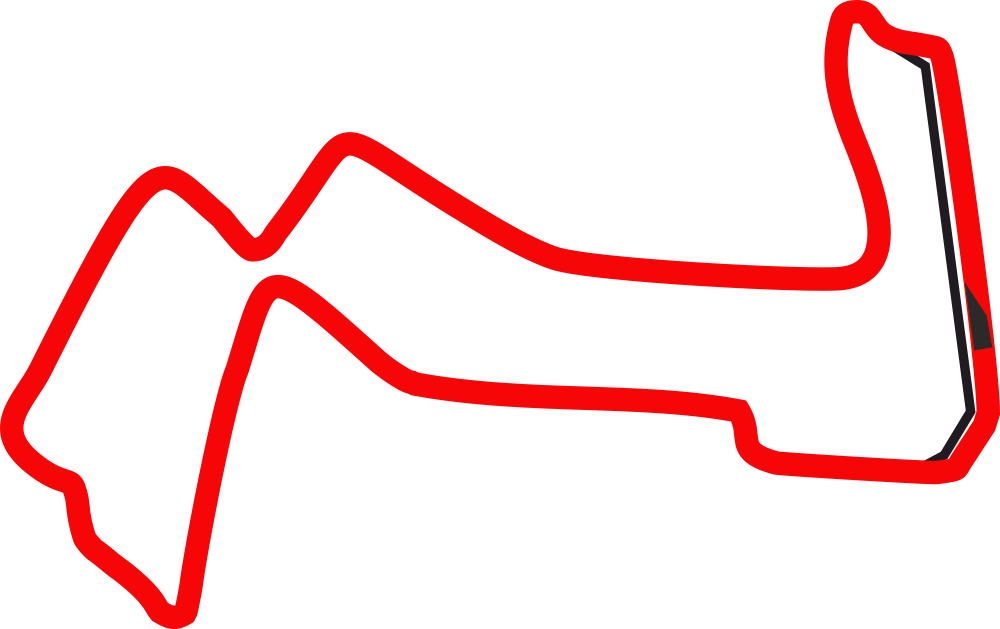
Figure 1 — Singapore Power Unit Information
Key points
The simulated 2026 pole-position lap (1:31.635) is 2.78% slower than Russell’s pole time last season (1:29.158). The 2026 times at circuits more similar to Singapore have been 3.00% slower (Monaco) and 2.43% slower (Hungary). In the simulation, the car reaches a top speed of 303.8km/h, around 12km/h lower than the 2025 model, because the electric motor has to switch off above 200km/h. The middle sector is almost identical to last year’s. Sector 2 (T7–T13) is only +0.191s slower. With the current generation of cars, drivers are required to brake differently from the past. This costs time, but does not explain the quick lap. Electrical-power availability should not be a problem at this circuit.

Figure 2 — Green = active power, no recovery (activation and operation with the ICE only). Red = recovery from lift-and-coast or braking. Orange = super-clipping under acceleration.
A ‘virtual’ lap of Marina Bay
- Sector 1: the straights hurt. The lap’s top speed, 303.8km/h, is reached at the end of the long straight leading to Turn 7, where the 2025 car was travelling at around 316km/h. Two opening corners taken slowly by the model (Turn 1 at 120km/h, Turn 5 at 140km/h) further increase the gap.
- Sector 2: almost on a par with 2025. Between T7 and T13, the 2026 car carries more speed than the 2025 car through several corners (T8, 83km/h versus 78km/h; T11, 121km/h versus 111km/h). The slowest point of the lap is T13 at 72km/h.
- Sector 3: power again. Time is lost on the straights after T14 and T15 and on the final run to the line because of the reduced thrust; T18 is also much slower than in 2025 (169km/h versus 215km/h).

Figure 3 — Sector times: Russell’s 2025 pole position (official) compared with the 2026 simulation.

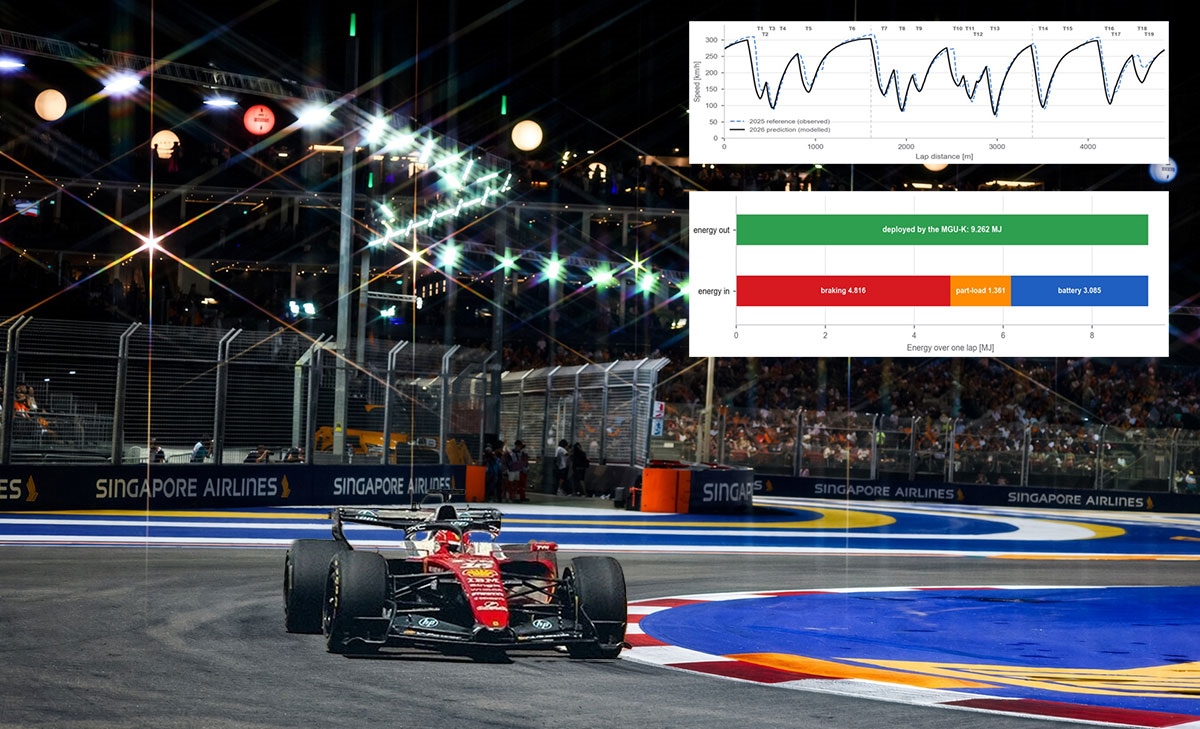
Figure 4 — Blue dashed line: Russell’s 2025 pole-position lap (measured). Black line: 2026 simulation.
Energy management over a lap
Every lap represents an energy balance. The car consumes 9.262MJ through the MGU-K. It recovers 6.177MJ during the lap and draws the remaining 3.085MJ from the battery, which starts at 3.143MJ and crosses the line almost depleted, at 0.057MJ.

Figure 5 — Lap energy balance: how much the MGU-K consumes (top) and where it comes from (bottom).
| source | energy | share | what it means |
| Braking | 4.816 MJ | 78 % | the MGU-K slows the car and charges the battery |
| Part-load | 1.361 MJ | 22 % | charging while partly on the throttle, mostly in corners |
| Lift-and-coast | 0 MJ | 0 % | not used: real 2026 qualifying laps at similar circuits show none |
| Super-clipping | 0 MJ | 0 % | not used: effectively zero at comparable circuits |

Figure 6 — Battery charge during the lap: it rises through T1–T3 (peaking at 3.577MJ), falls along each straight and is depleted at the finish line.
Nothing is wasted: the battery never reaches its minimum safety level during the lap, and the car never needs the full 9MJ of recovered energy.
Straight-line mode: the low-drag wing is open for 1643.7m of the lap, across the five straights where it is permitted.